Campaign Stats
Your Really Simple Systems CRM logs your email campaigns against each customer account and records the engagement with your individual contacts. You can monitor and manage your ROI (Return on Investment) and see which campaigns are most cost effective.
When you send an email marketing campaign, the details of who, what and when are logged in your CRM and you can view this by Campaign, Campaign Stage and at customer account level. The Campaign Statistics shows who you mailed, whether the contact opened your message, whether they clicked through on your links or whether they unsubscribed from your messages. It will also record any issues found with a contact’s email address showing ‘bounces’ and undeliverable addresses.
Dashboard
You can set up the widgets on your Marketing Dashboard to show how your marketing campaigns are performing.
New Leads
When you get new leads you can log them against the relevant campaign and these will then display in the new lead table widget on your dashboard, as well as the other widgets available.

Campaign Data in CRM
As all your marketing data is fed back to the customer account page your sales people will also be able to see how your customers responded to a campaign.
For an overview of your campaigns, click Campaigns on the Marketing menu. This displays a summary of your campaigns, as shown below. You can sort the data by clicking on the column headers.

Stats at Campaign Level
To view your Campaign Statistics at the Campaign level, on the Campaign summary table, open the campaign by clicking on the campaign name. Here’s you’ll see a chart showing your engagement levels by Campaign Stage, with the opens, clicks, unsubscribes and spam reports.
Below this is a table showing the numeric values of how many contacts were mailed and data sub-sets of how many opened the message, clicked through, unsubscribed etc. It shows the unique number of actions, total actions and activity rates as a percentage.

Below this is a table showing the click through links and how many total click-throughs each link received and the number of contacts that clicked. This gives a good indication of what your customers find most engaging. You can see who has clicked-though by clicking the clickthrough links.
N.B. Unique clickthrough stats count how many individual contacts have clicked your links whereas the total clickthroughs, include multiple clicks in the same link.
Stats by Campaign Stage
If you have created multiple Campaign Stages you can also view your stats by the Campaign Stage. Maybe you have segmented customers by different locations, or separated prospects from customers, or maybe you are running A/B testing to see how different emails, titles and text impact your response rate.
To view your stats by Campaign Stage, in the open campaign click on the Campaign Stage Name. This shows the activity and engagement over a time line for just the contacts included in that stage segment. Comparing data from your different stages will give insight into the engagement and interest of your different customer groups.

Below the Link Clickthrough stats your will also see a list of all the contacts in the campaign stage and their status on how they responded. You can click through to the customer account or contact name from this table.
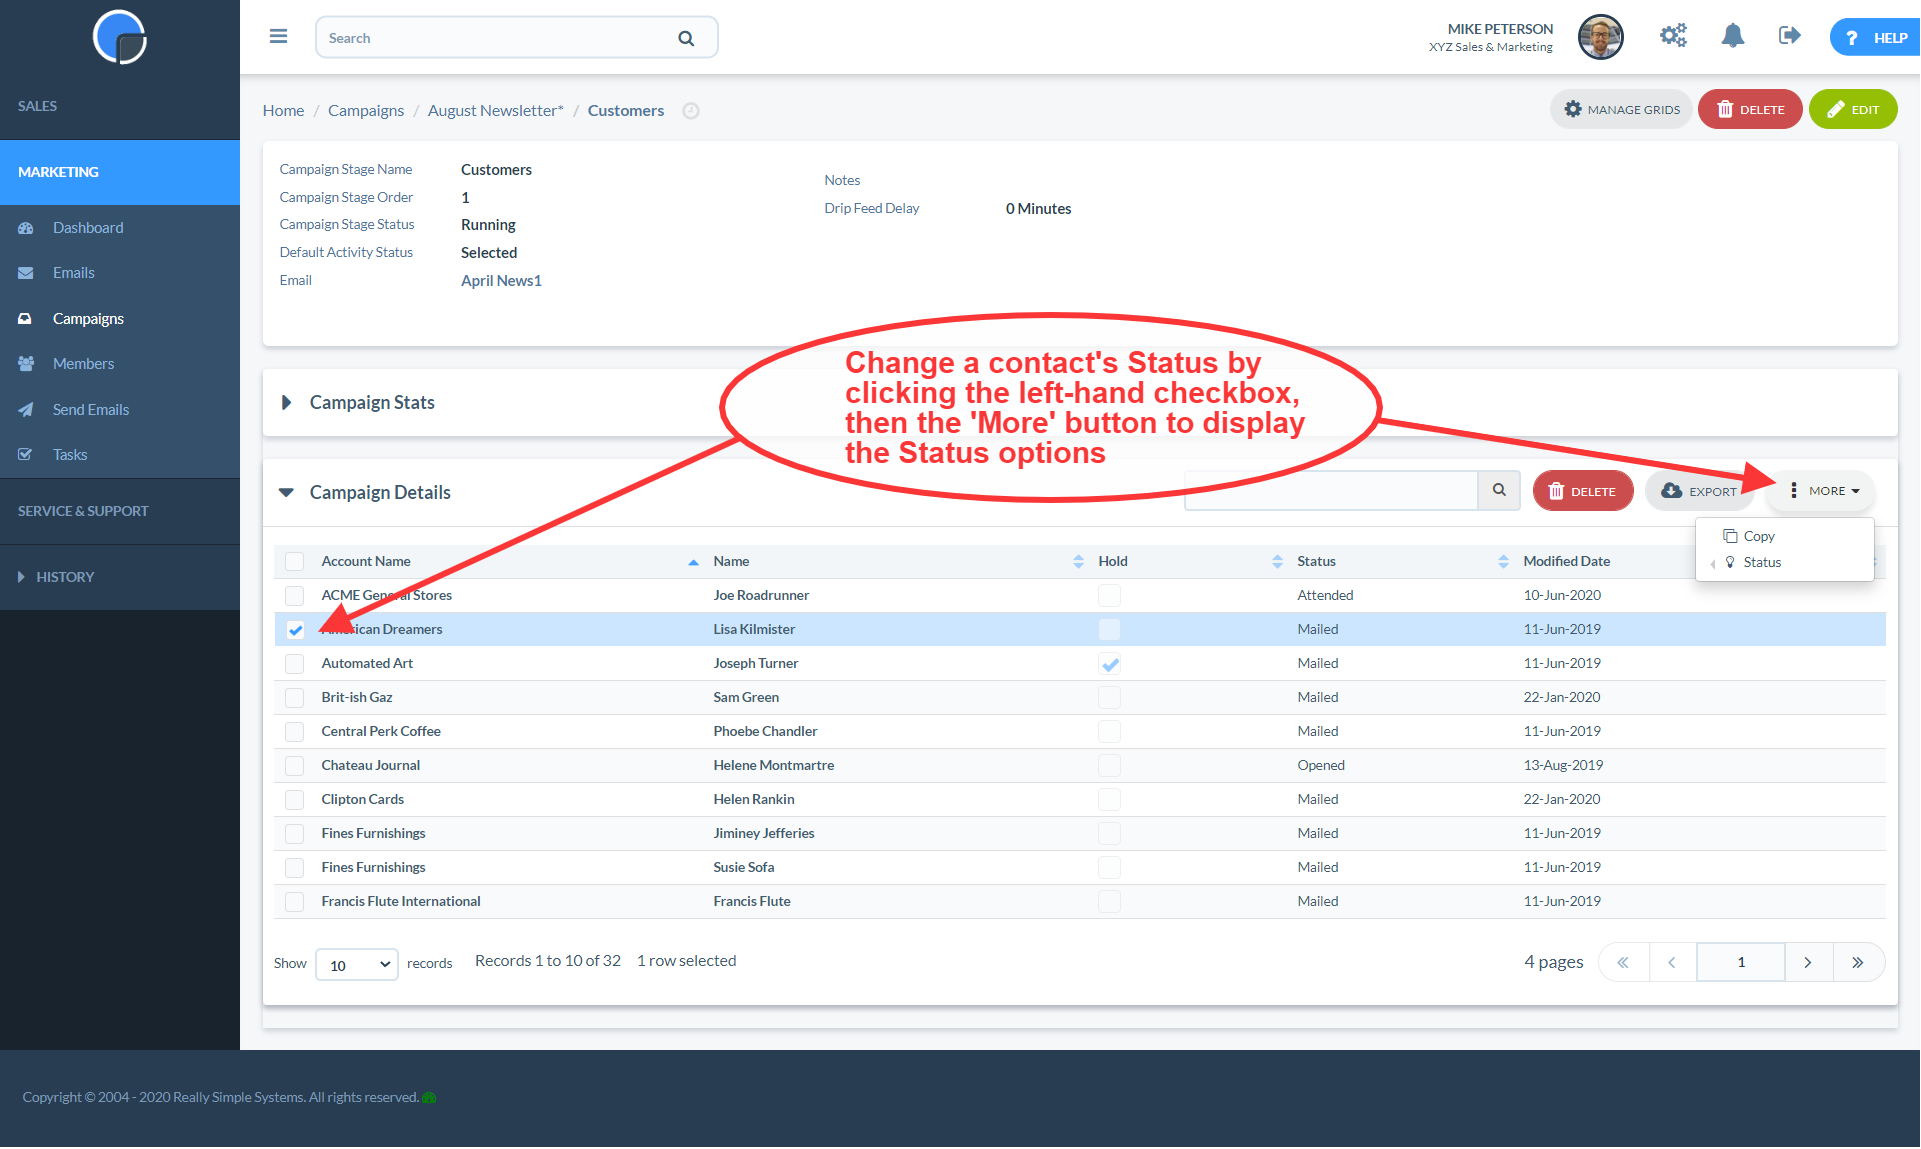
Edit Contact Status
If you are following up the campaign with a telephone call or maybe you wish to record a further activity in connection with the campaign, for example if the contact attended an event you are organising, you can update the contact Status. Click the checkbox next to the contact’s details and then go to the ‘More’ button and from the Status dropdown list select the new status.
Managing ROI
The Marketing tool also allows you to manage and monitor other marketing campaigns you might be running. For example, AdWords, Pay-Per-Click, display advertising, exhibitions and events.
Simply create a campaign and log any new leads you receive in response to that campaign name.
If your campaign has a cost associated with it you can record your budget, and later the actual cost, in the campaign form. Then, as your leads and opportunities come in your CRM will generate data that will calculate your cost per lead, cost per opportunity and cost per sale.
Viewing your campaigns on the summary grid you can sort your data by the columns so you can display your most cost effective campaigns at the top.
