Adding Dashboard Widgets
Every CRM user can create their own personalised dashboard, highlighting the data that’s important to them.
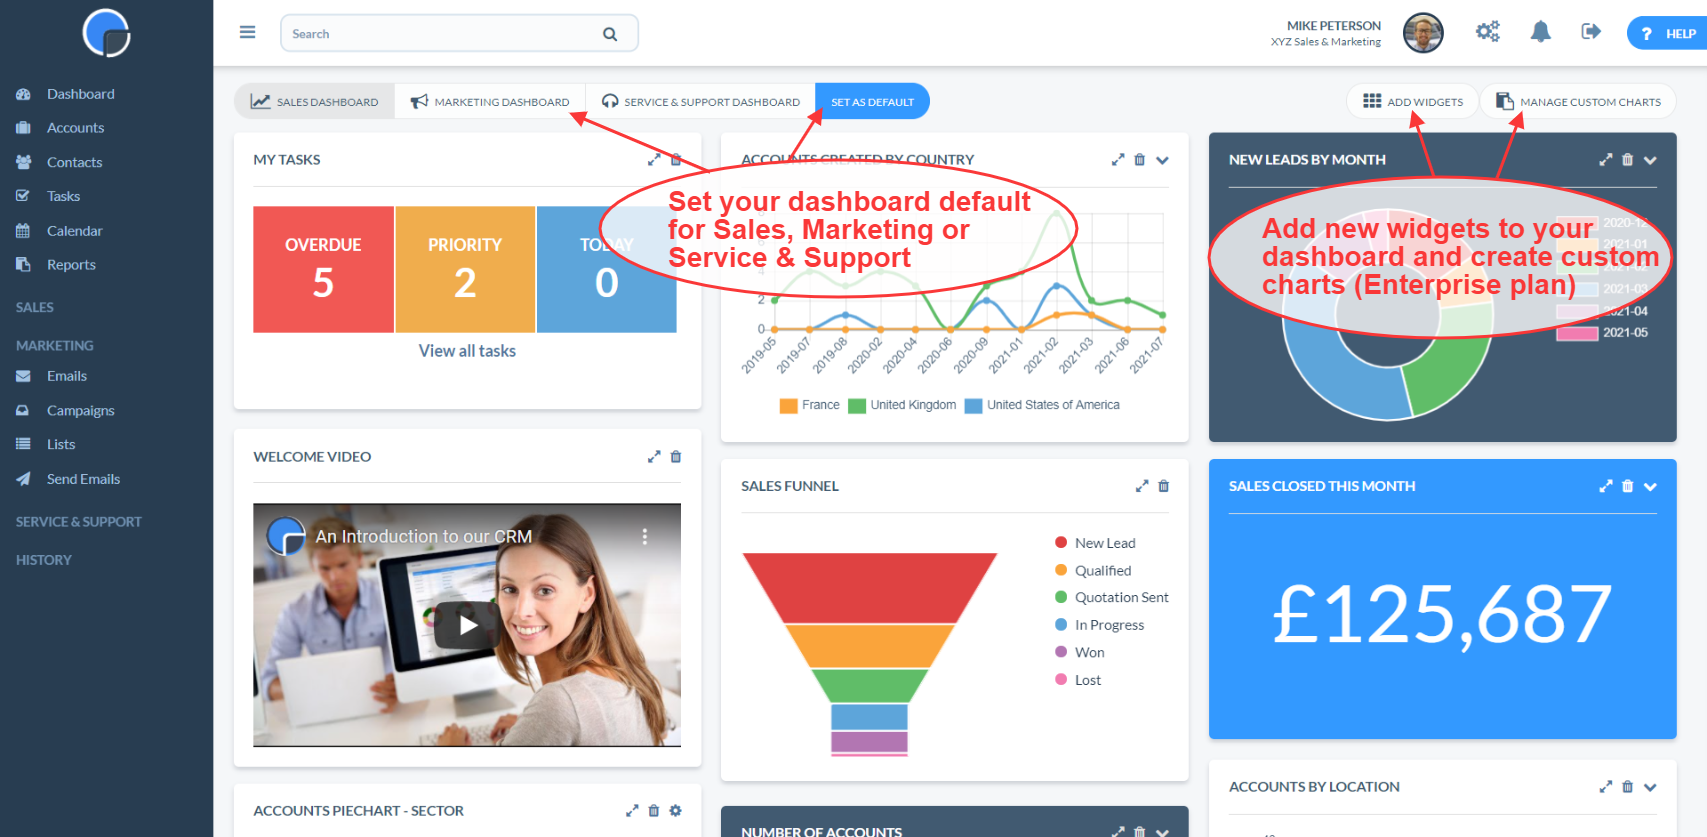
If you are using the Sales CRM as well as Marketing and/or the Service & Support tools, you can select which dashboard to use as your default view.
To add a new widget click the “ADD WIDGETS” button on the right of the screen and this will open the widgets menu. If you are using the Enterprise plan you will also be able to create your own Custom Charts.
Move, Resize, Edit and Delete Widgets
In the top-right corner of each widget you’ll see icons to resize and delete. To move a widget on your dashboard, simply click in the title bar, then drag and drop it to the new location – it will automatically “snap-to” for the best fit. Clicking the delete icon will remove the widget.
The Configurable Widgets also show an edit icon. Clicking the edit icon will display the optional settings for this widget.
![]() Resize Icon
Resize Icon
![]() Delete Icon
Delete Icon
![]() Edit Icon
Edit Icon
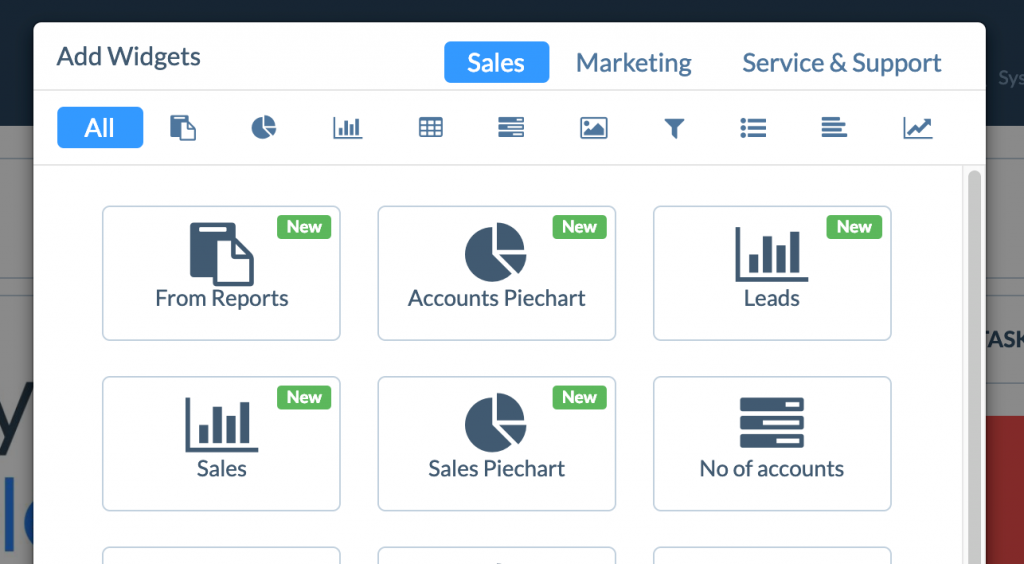
Add Widgets
At the top of the page you will see that the widgets available have been divided into the relevant sections for Sales, Marketing and Service & Support. Hold your mouse over the widget you want and it will turn green, then click to add. Widgets that are already in use will appeared greyed-out. You can add widgets to your Sales, Marketing and Service & Support dashboards
At first, your widgets will be empty but as you start to use your CRM, adding company accounts and opportunities, the widgets will be populated automatically.

Tasks
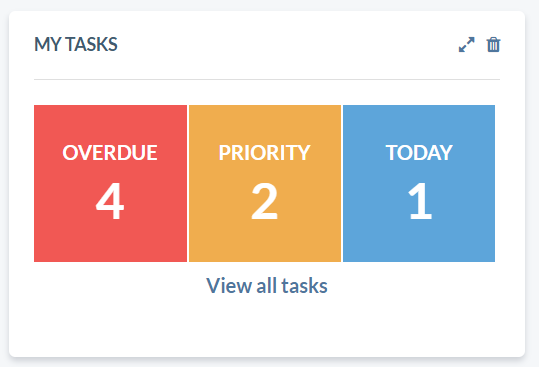
The Tasks widget give you a summary of your outstanding Account Tasks, sorted by the date due and priority:
Overdue (red) = overdue means past the due date/time – i.e. today before now, yesterday and earlier (not including todays tasks without a set time)
Priority (orange) = Where priority is set to “high” and “really high”, or due for today/overdue (i.e. before now, or today with no time)
Today (blue) = this shows any tasks with a date of today (either all day, or time specific)
Opportunity and Forecast Summary
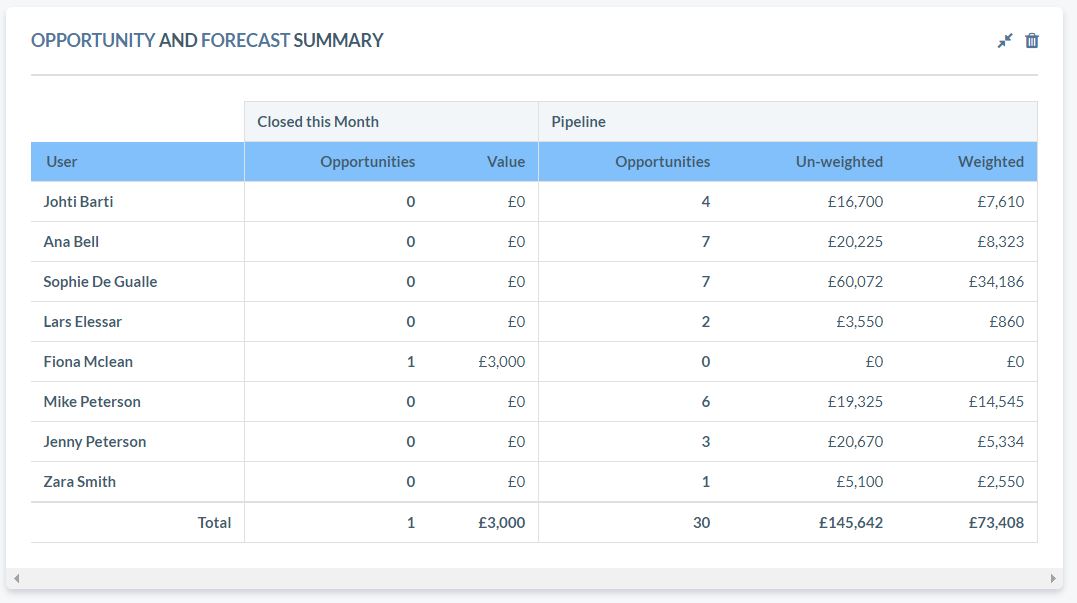
The Opportunity and Forecast Summary widget creates a table on your dashboard, summarising your Opportunities for the month. It show the Opportunities closed, those still in your pipeline and the unweighted and weighted values. As your Opportunities move through your pipeline and you change the status, for example to Won/Closed and 100%, the Opportunity will move to the closed column on the grid.
Sales Funnel
The Sales Funnel gives a visual representation of your outstanding opportunities and their value. The funnel is divided into the different stages of your sales cycle you have set. Holding your cursor over each section will display the number of opportunities at that stage and their value.

Company Logo
To add your company logo to your dashboard, first select the Company Logo widget in Add Widgets. This will create a logo placeholder on your you dashboard. Then click on the widget and choose your logo file to upload.
![]()
![]()
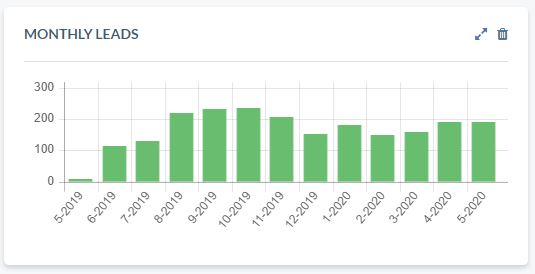
Monthly Leads
On the Marketing Dashboard there is a widget to track the effectiveness of your campaigns called Monthly Leads. To populate the widget, open the Account, and find the relevant campaign name from the dropdown list in the Campaign field.
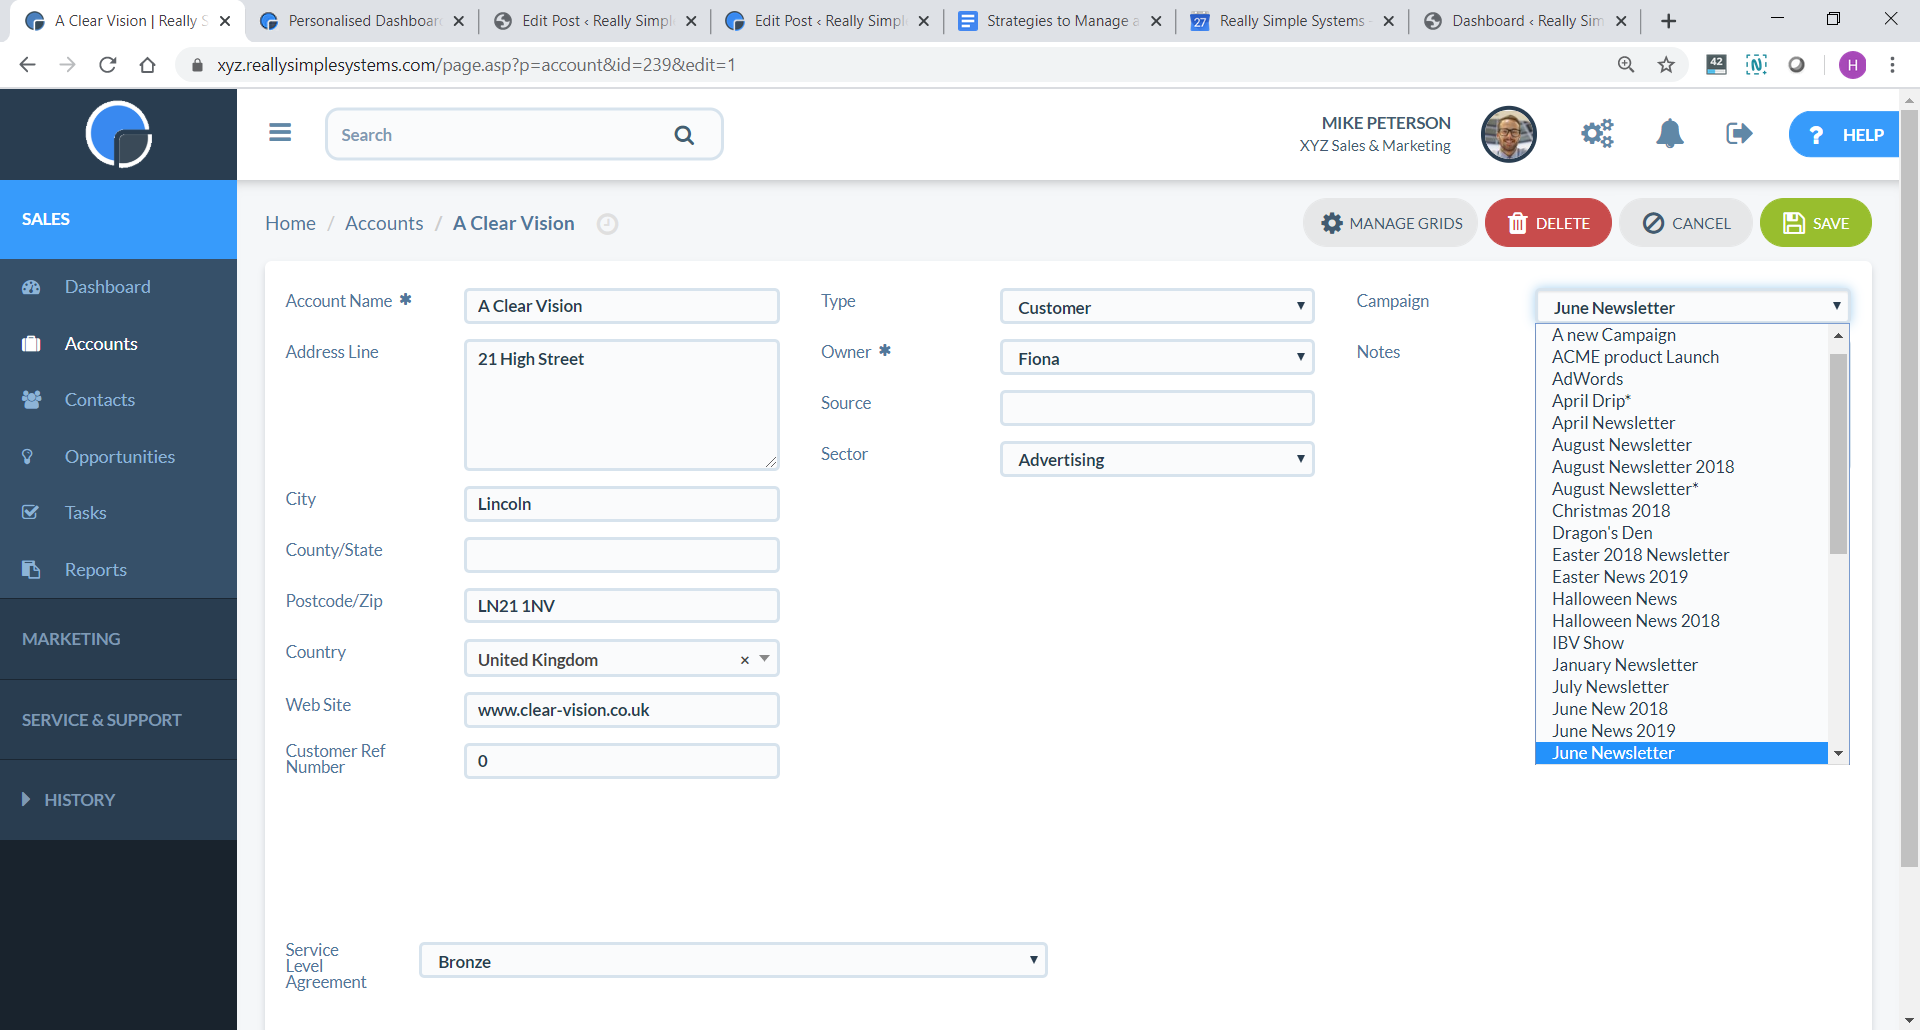
You will then see a monthly total on the widget graph.
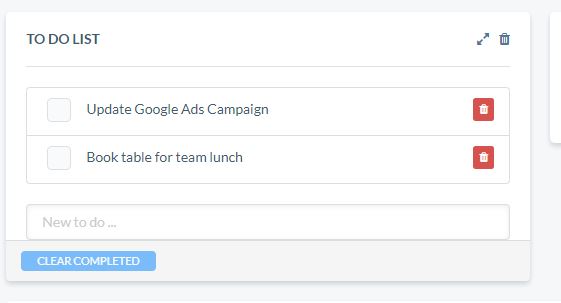
To Do List
The To Do List widget lets you create a simple list on your dashboard for tasks that are not related to any dates, accounts, opportunities or cases. It’s useful for non-sales CRM users whose tasks are not date specific or related to any customer accounts. The new widget is added to a dashboard in the normal way from the Add Widgets button.
Once added, you can create a new “to do” just by typing into the input box and pressing return, or clicking away from the input. Your new items will appear in a list that looks like this:
You can edit an existing item by double-clicking on it, typing and then pressing return/clicking away. The checkbox on the left, when clicked will set the item as complete, shown by fading out and having a strike-through on the text.
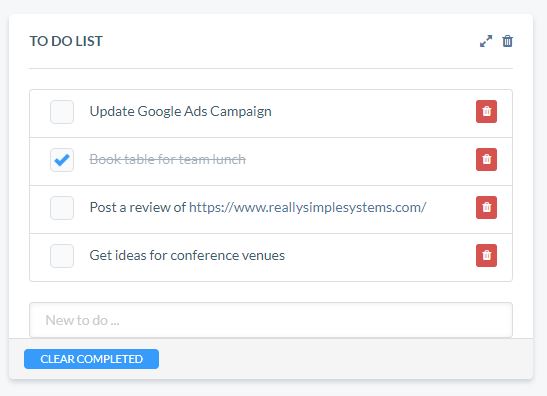
The trash icon will remove that one item, while pressing “Clear completed” will remove all completed/ticked items in one go
Configurable Widgets
In the “ADD WIDGETS” menu you can create Configurable Widgets that display variable data on your dashboard.
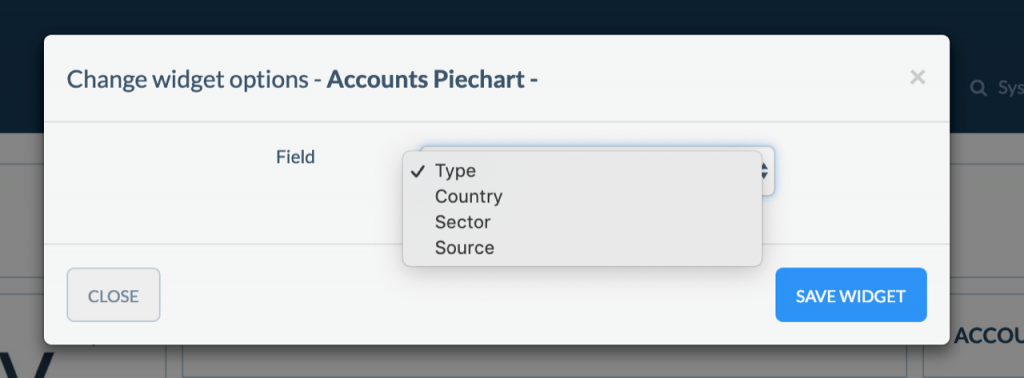
An example is the “Accounts Piechart”.
Once you click on “Accounts Piechart” you will see a new window asking you to select the data field. Here you can choose Type, Country, Sector, or Source before saving the widget to your dashboard. You can edit the settings at any time using the edit icon in the corner of the widget.
Custom Charts
Custom Charts are available on the Enterprise plan, letting you can create your own dashboard widgets from your CRM data. This might be a summary of your customer accounts, sales revenue or maybe a custom field you’ve added. Charts are created in a similar way to your CRM reports, with output values displaying as pie charts, line charts, bar charts, gauges, or just a numerical value.
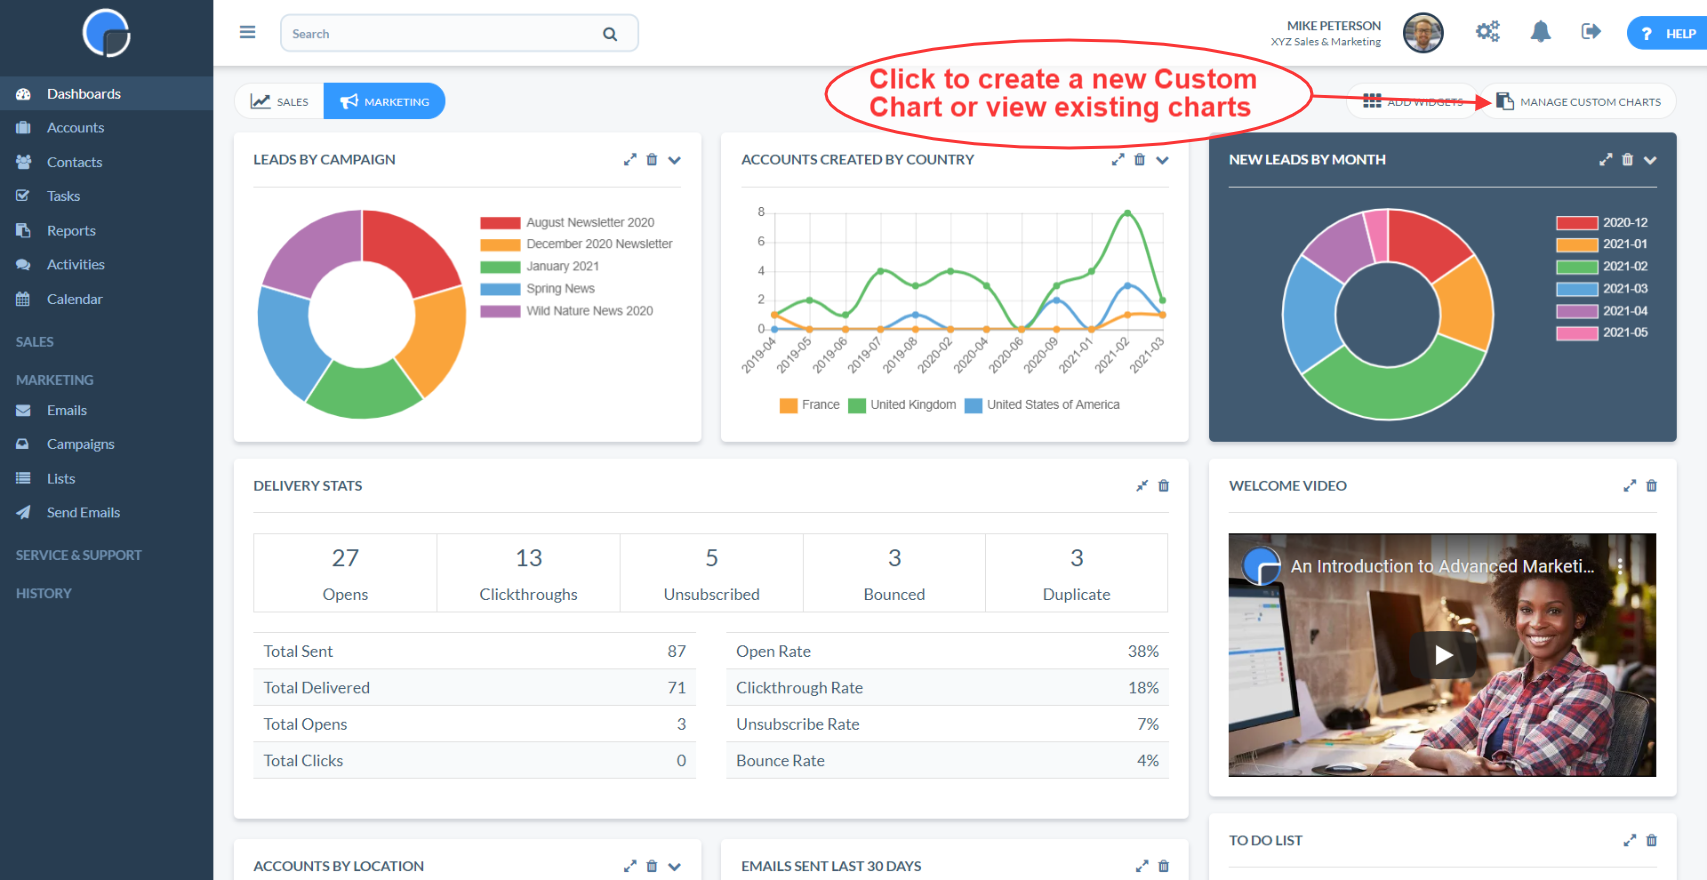
Find our more about Custom Charts.